
Hello world , this project is done by Ismail Ouahbi a data science student .
In data mining, Exploratory Data Analysis (EDA) is an approach to analyzing datasets to summarize their main characteristics, often with visual methods. EDA is used for seeing what the data can tell us before the modeling task. (credit chartio )
Step by Step
As a starting point , I've taken the "titanic" data set , which is a famous data that you can start your data science journey with , you can download it through this website :
kaggleData preview
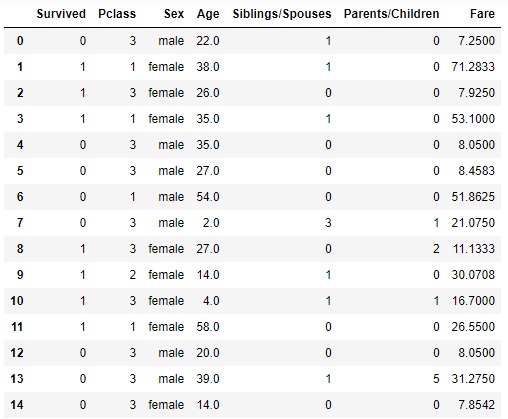
Titanic data set contains 7 columns , 6 features ['Pclass','Sex','Age','Siblings/Spouses','Parents/Children,'Fare'] & one target ['Survived'] The 7 features are indicating a sum of informations about each passenger (does this passenger have siblings ? his gender & age ? and what about the fare (amount paid for this journey) ?..etc and of course as for each data set there is a purpose , this one is for classification ML algorithms so the target will be a prediction to wheter the passenger will survive or not
The EDA process
As the lines of code are too long , I will discuss the EDA part only and then let a pdf file for you in which you can read my code & discover the entire process for preparing this data
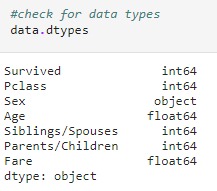
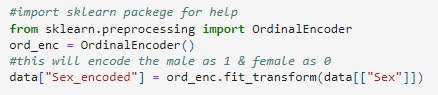
as you can notice the "Sex" feature is categorical , let's make it numerical
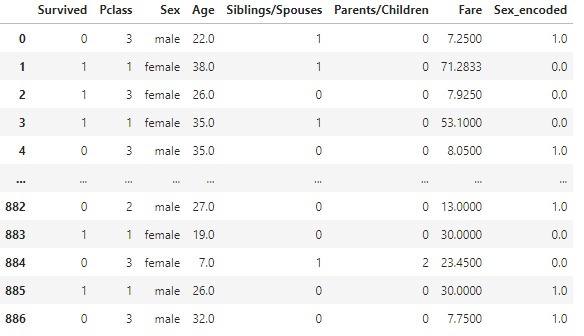
now that the "sex" column is encoded , let's check out the data to see the difference
let's get some statistical measurements:
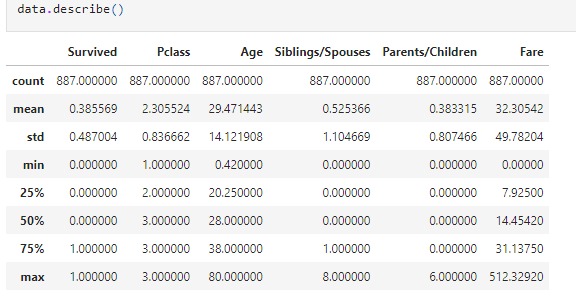
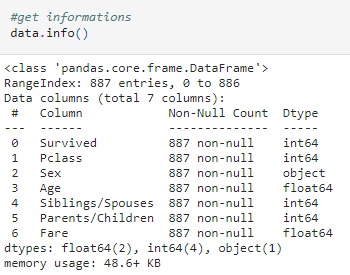
It's very useful to check the statistical measurements and know how your data is distributed . let's check also for non-null values and memory usage by the data :
After that , let's continue exploring the data using some plots :
Box-plot
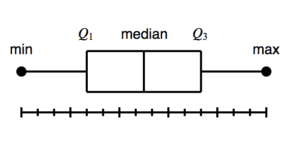
A box plot – displays the five-number summary of a set of data. The five-number summary is the minimum, first quartile, median, third quartile, and maximum. see the below figure to know more .(credit chartio )
Now that we know about box-plot , let's box-plot our data and see what we can extract as insight.
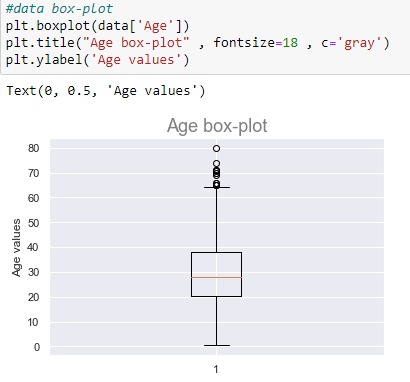
Apart from the 5 measurements that we can extract using box-plot , we can notice that a few outliers exist at the "Age" column which is a good information to know before applying any machine learning algorithm to this data .
Histogram
A histogram is a plot that lets you discover, and show, the underlying frequency distribution (shape) of a set of continuous data. This allows the inspection of the data for its underlying distribution (e.g. normal distribution), outliers, skewness, etc. (credit chartio )
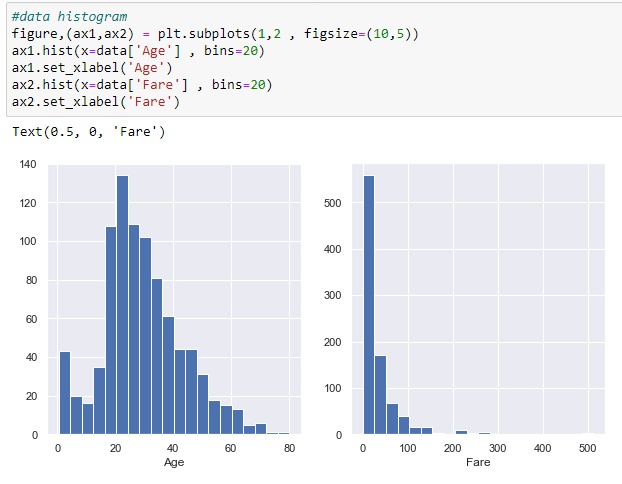
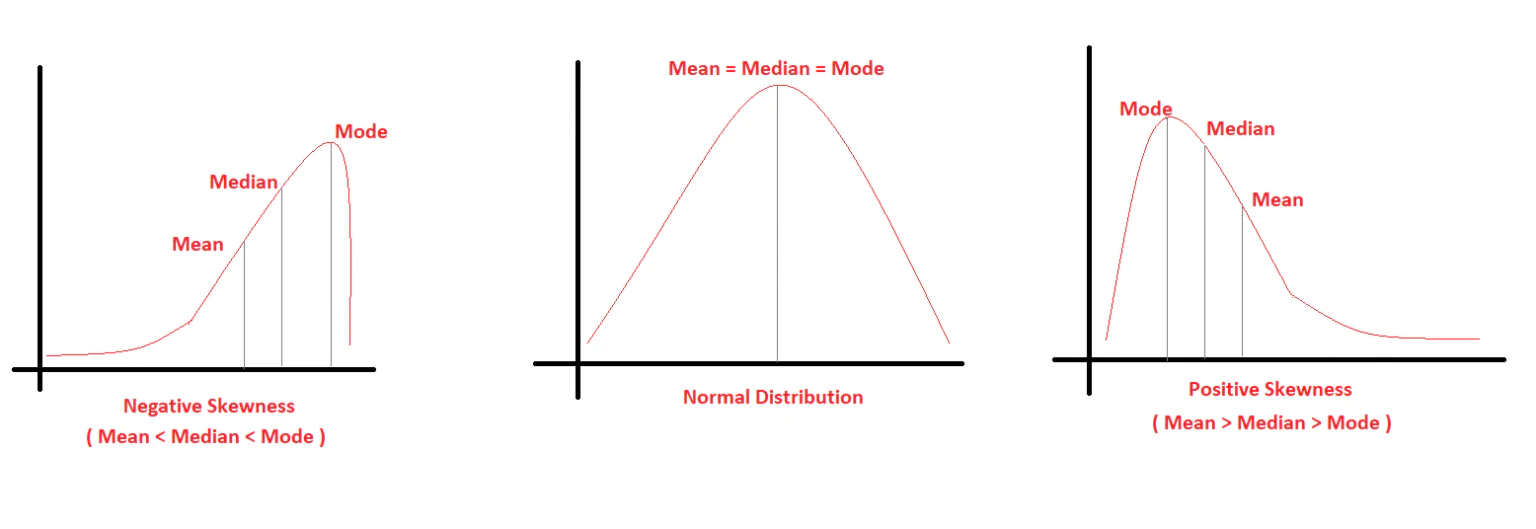
From the above two plots , the "Age" column almost follows a Gaussian distribution but it's a little bit positively skewed . However , "Fare" column is noticeably skewed positively . To give you an idea about skewness see the below image :
You may ask why skewed data can be harmful ? check out this article to see more Skewed Data: A problem to your statistical model
Make skewed data more centered
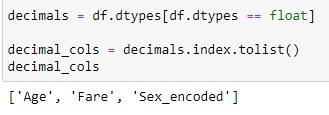
check for skewness (to decide whether a feature is (~) normaly ditributed or not) to make skewed variables symmetric let's first extract just decimal features
define a limit above which we will log transform and check skewness value for decimal columns
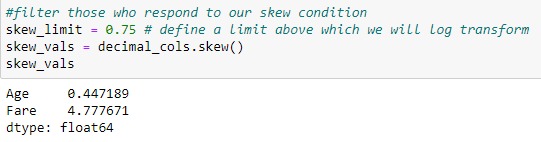
we can notice that the skewness value for the age column can be neglected.
Let's filter that using our skew_limit approach :

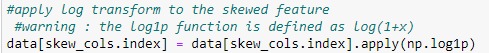
Now that our column is ready to be transformed , let's start the log transform process :
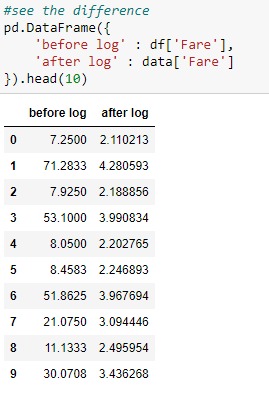
Let's plot the original vs transformed column to ensure the transformation :
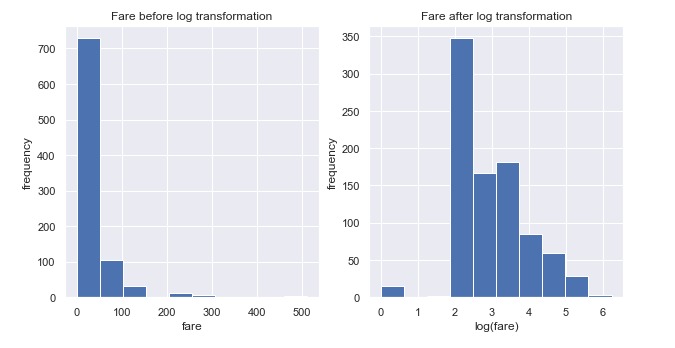
As expected, our data is more centered than before which is a good step.
That was an introduction project to the world of analysis , stay tuned for more advanced projects , and don't forget to download my entire project paper for more details & code (using python) , to do click the button below :
download all codeThanks for reading .
by Ismail ouahbi | home