Data analysis is a process of inspecting, cleansing, transforming, and modelling data with the goal of discovering useful information, informing conclusions, and supporting decision-making.[1] Data analysis has multiple facets and approaches, encompassing diverse techniques under a variety of names, and is used in different business, science, and social science domains.[2] In today's business world, data analysis plays a role in making decisions more scientific and helping businesses operate more effectively. (credit wikipedia )
Step by Step
As a starting point , I've taken the "titanic" data set , which is a famous data that you can start your data science journey with , you can download it through this website :
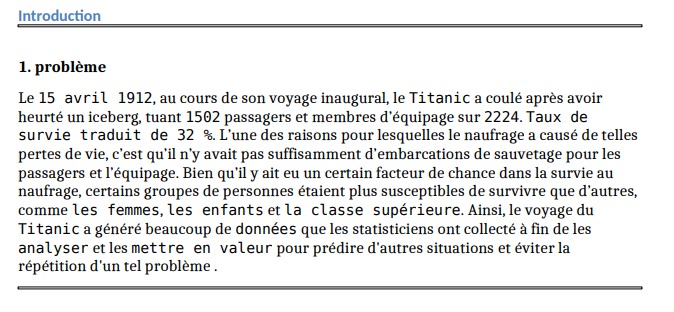
kaggleProblem Introduction
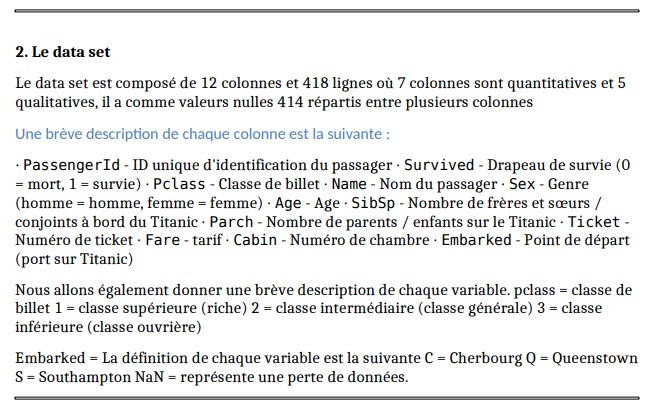
Data Set description
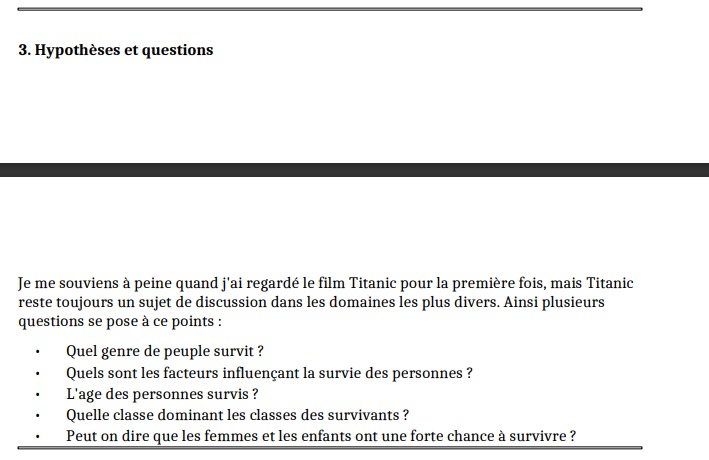
Hypothesis & Questions
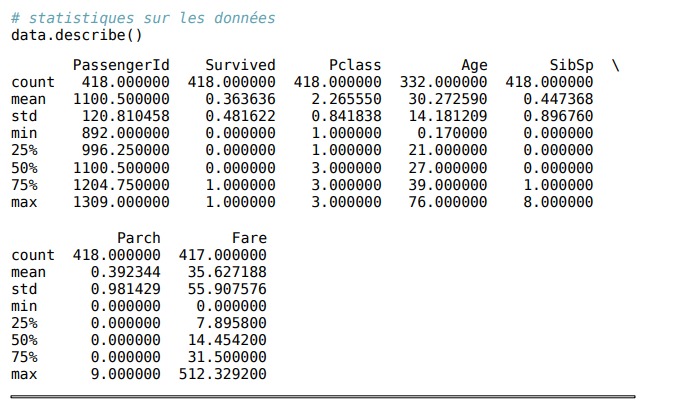
Data` statistics
Data preprocessing
Null Values
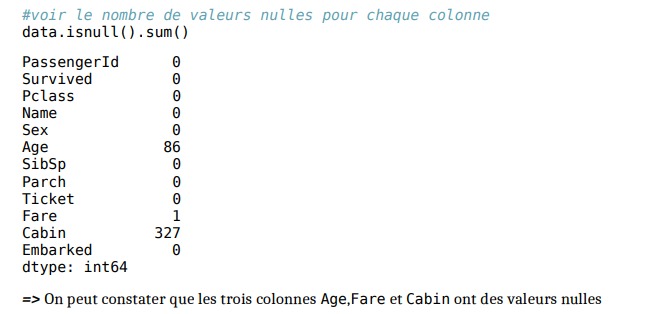
Null Values-sum-

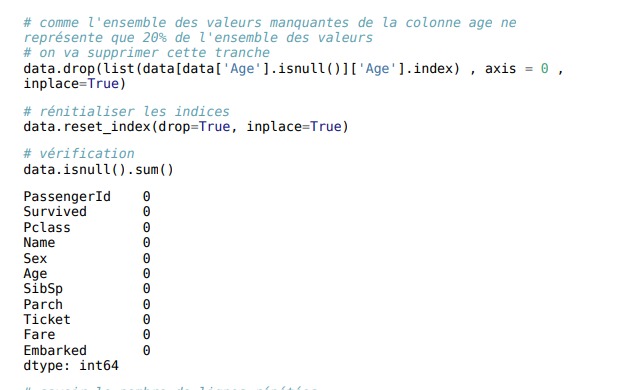
Dealing With Missing Values
For Fare column
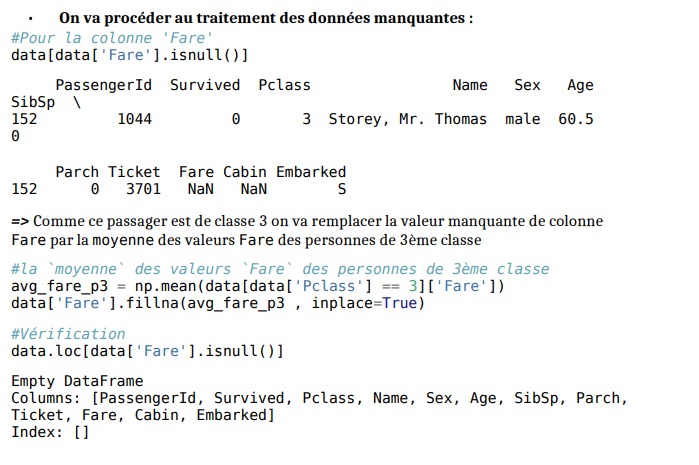
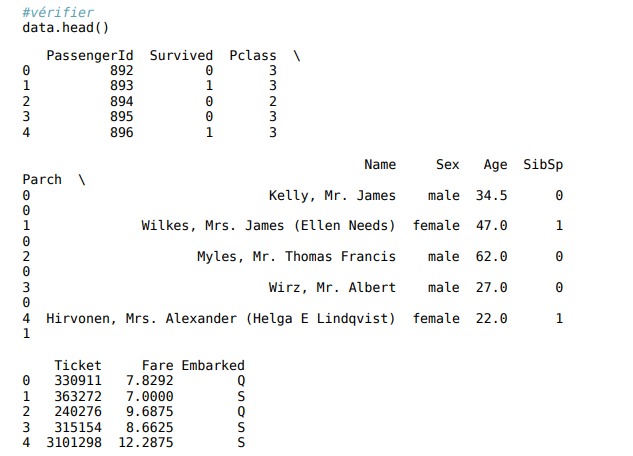
For Cabin column

For Age column

Analysis Part
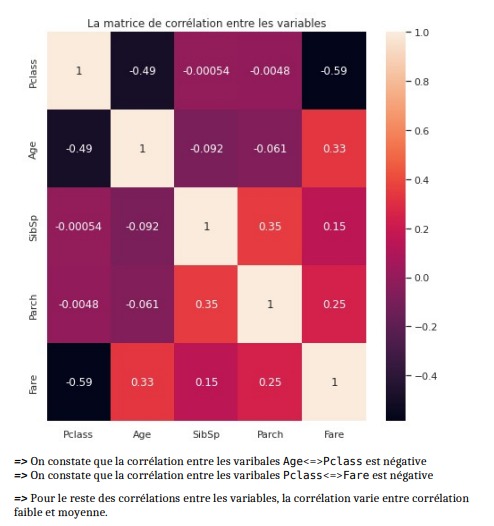
Heatmap(correlation matrix)
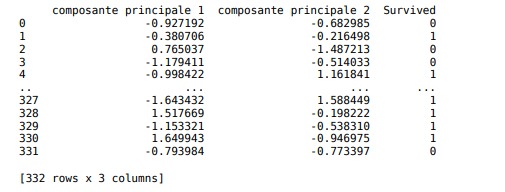
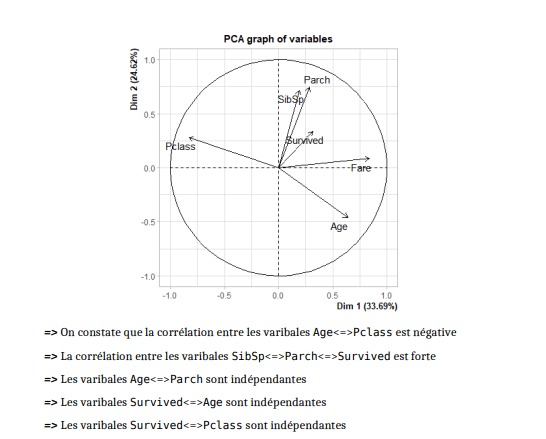
PCA Part
Stay tuned for more advanced projects , and don't forget to download my entire project paper for more details & code (using python & R) , to do click the button below :
