
Business intelligence (BI) refers to the procedural and
technical infrastructure that collects, stores, and analyzes the
data produced by a company’s activities. BI is a broad term that
encompasses data mining, process analysis, performance
benchmarking, and descriptive analytics. BI parses all the data
generated by a business and presents easy-to-digest reports,
performance measures, and trends that inform management
decisions. (credit investopedia )
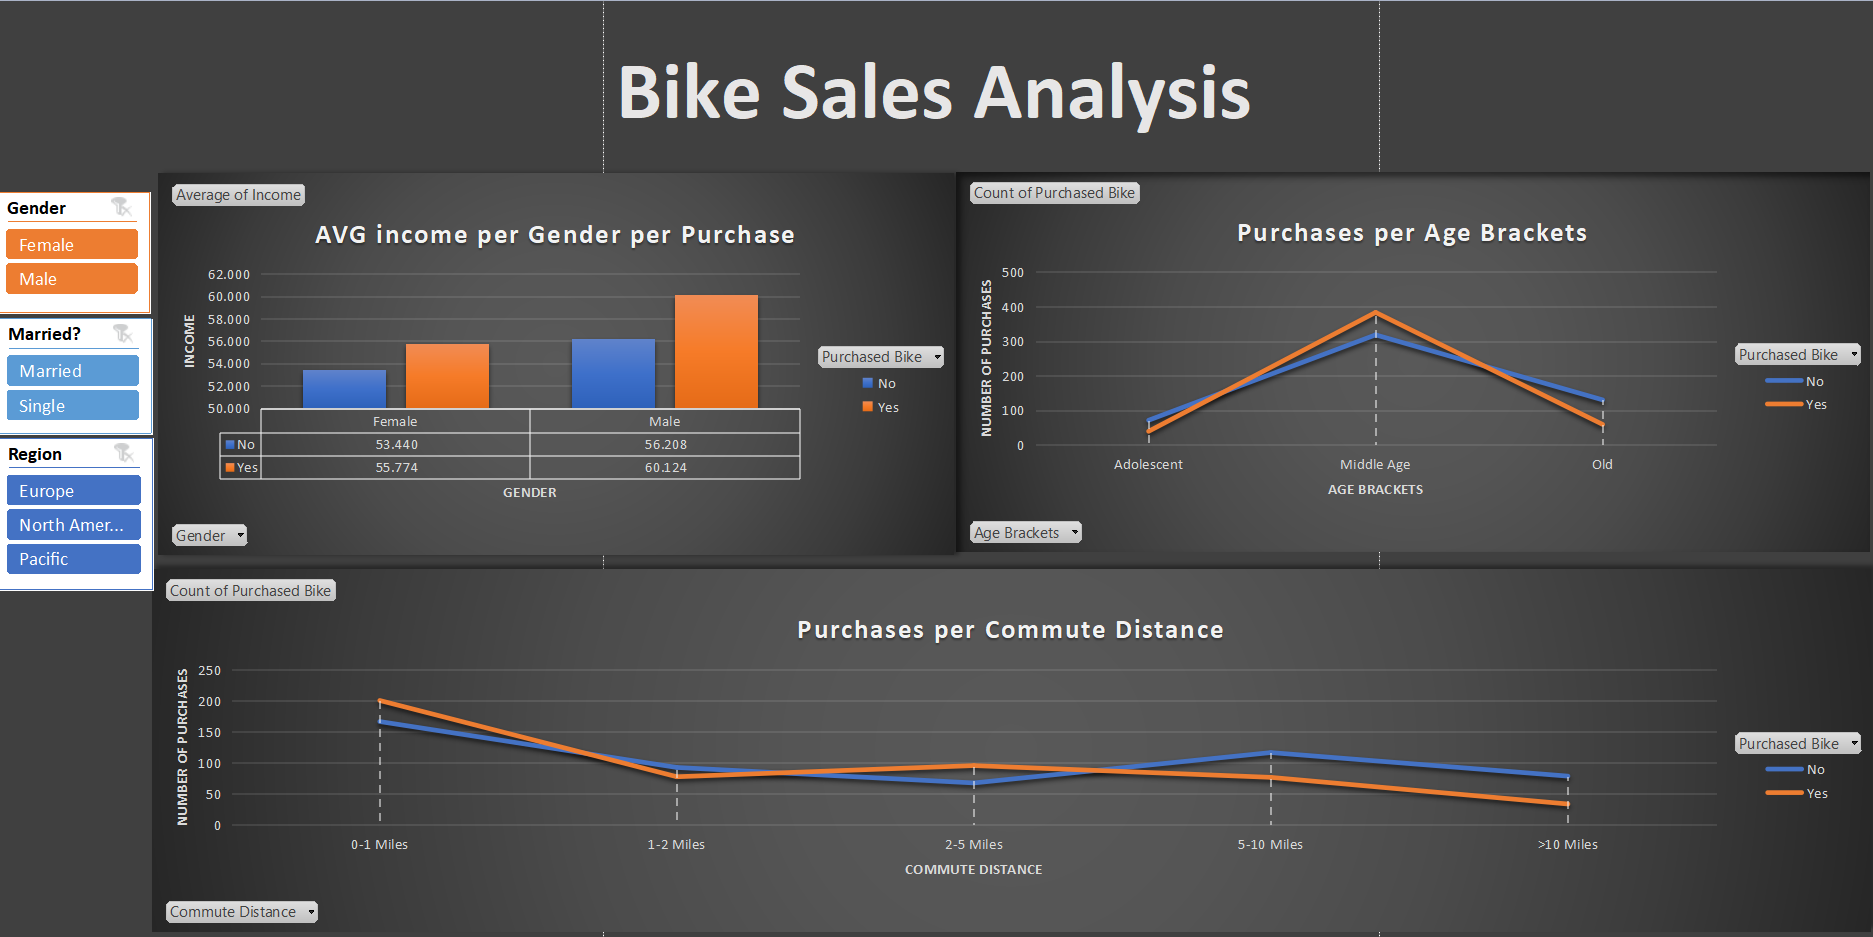
Preview Dashboard (part by part)
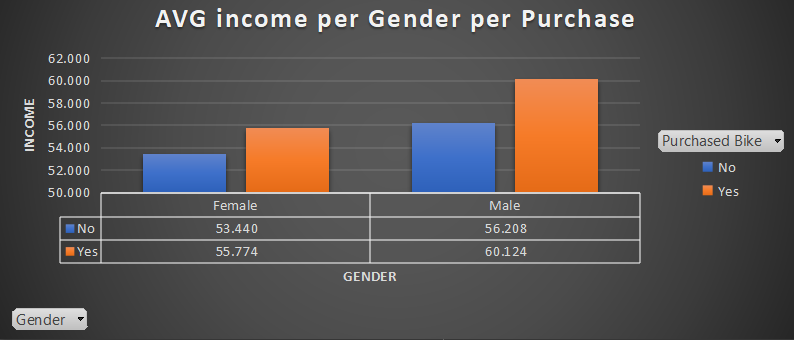
The graph above shows the distribution of average income by gender and by applying the "purchased bike" filter we notice that most people have bought bikes.
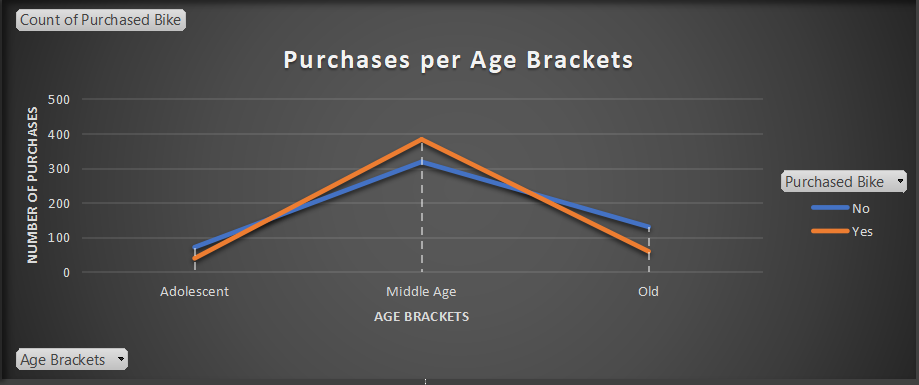
Looking at the graph above, we notice that the dominant age bracket over purchases is the "Middle Age (31-54)" bracket.
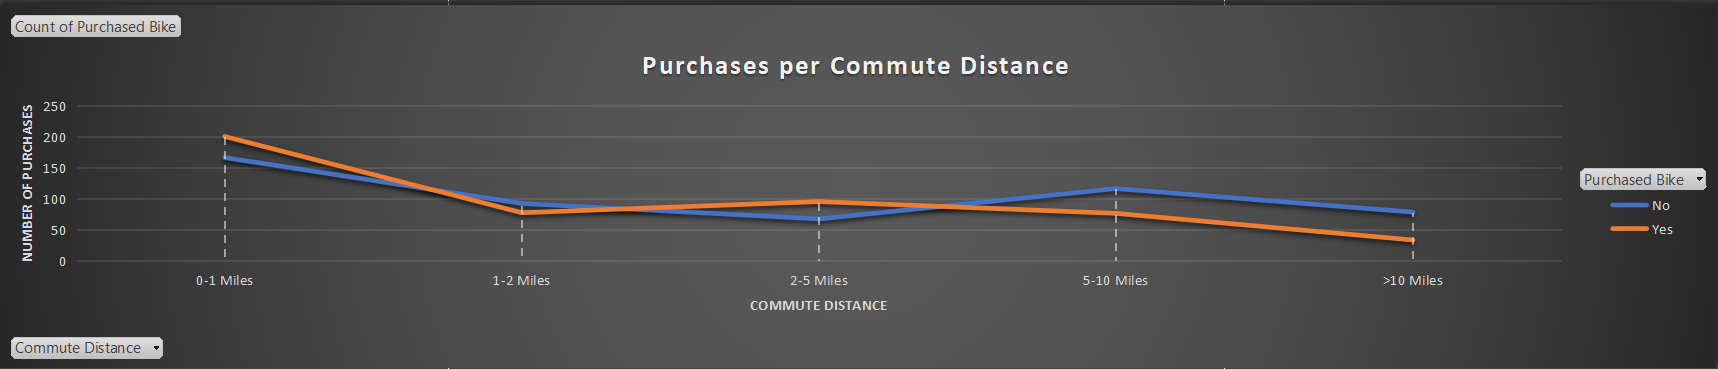
From the above graph, we notice that: - Persons with a commute distance of less than 1 mile tend to buy more bikes. - Persons with a commute distance of>10 miles tend to buy fewer bikes.
Overall, our final recommendations are:
- Target the "Middle Age (31-54)" bracket.
- Target people with a commute distance of less than 1 mile.
Thanks for reading .